Cài đặt VmWare Exporter (Prometheus) để giám sát các Server sử dụng Esxi

Cần có kiến thức cơ bản về docker như image, container docker-compose, volumes, port, service,... và nắm được file mib, snmp, lệnh linux căn bản

OS: Centos 8

1. Tổng quan

Chức năng của VmWare Exporter là export ra các thông số (metrics) của máy chủ đang sử dụng ESXI. Sau đó Prometheus Server sẽ scrape các thông số này và đẩy sang cho Grafana visualize thành các đồ thị.

Như vậy công việc cần làm là

  1. Cài đặt và cấu hình Vmware Exporter
  2. Cấu hình Prometheus để scrape data từ Vmware Exporter
  3. Tạo dashboard giám sát trên Grafana

2. Vmware Exporter

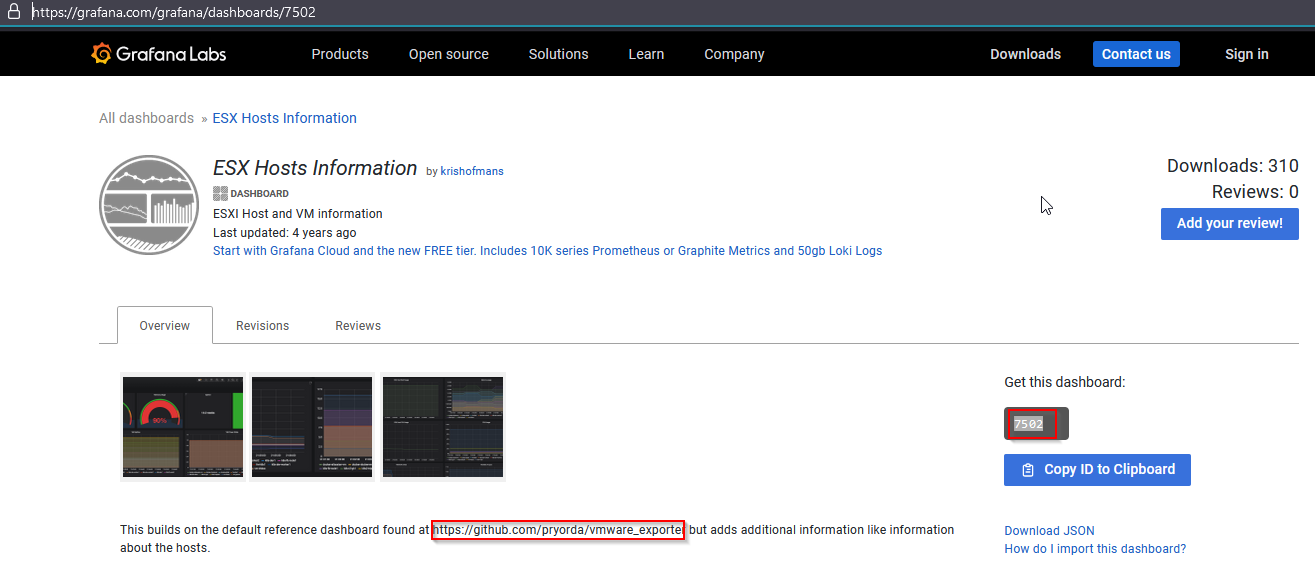
Trong bài viết sử dụng exporter tại đường dẫn https://github.com/pryorda/vmware_exporter. (Có thể sử dụng các vmware exporter khác nếu muốn, vd: https://github.com/devinotelecom/prometheus-vmware-exporter).

Pull Image về:

docker pull docker pull pryorda/vmware_exporter

Tạo file config.yml cho exporter có nội dung như bên dưới (Có thể tạo ở đâu cũng được, trong bài viết là /etc/prometheus-docker/vmware_exporter/config.yml):

vi /etc/prometheus-docker/vmware_exporter/config.yml

default:
    vsphere_host: "192.168.10.5"
    vsphere_user: "monitor"
    vsphere_password: "123456"
    ignore_ssl: True
    specs_size: 5000
    fetch_custom_attributes: True
    fetch_tags: True
    fetch_alarms: True
    collect_only:
        vms: True
        vmguests: True
        datastores: True
        hosts: True
        snapshots: True
esxi1:
    vsphere_host: "192.168.10.6"
    vsphere_user: "monitor"
    vsphere_password: "123456"
    ignore_ssl: True
    specs_size: 5000
    fetch_custom_attributes: True
    fetch_tags: True
    fetch_alarms: True
    collect_only:
        vms: True
        vmguests: True
        datastores: True
        hosts: True
        snapshots: True

Lưu ý: config.yml yêu cầu phải có default, còn các host còn lại đặt tên gì cũng được.

3. Điều chỉnh cấu hình của Prometheus

Add thêm nội dung như sau để Prometheus Server scrape được metrics của Vmware Exporter

################################ VMWARWE
  - job_name: 'esxi-1'
    metrics_path: '/metrics'
    static_configs:
      - targets:
          - "192.168.10.5"
        labels:                          
          hostname: ESXI-1
          type: esxi-host
    params:
      section: [default]
    relabel_configs:
      - source_labels: [__address__]
        target_label: __param_target
      - source_labels: [__param_target]
        target_label: instance
      - target_label: __address__
        replacement: 192.168.10.2:9272
  - job_name: 'esxi-2'
    metrics_path: '/metrics'
    static_configs:
      - targets:
          - "192.168.10.6"
        labels:                          
          hostname: ESXI-2
          type: esxi-host
    params:
      section: [esxi1]
    relabel_configs:
      - source_labels: [__address__]
        target_label: __param_target
      - source_labels: [__param_target]
        target_label: instance
      - target_label: __address__
        replacement: 192.168.100.2:9272

Lưu ý: section phải khớp với tên host đã được định nghĩa trong file config.yml

4. Start hệ thống

Thêm nội dung sau cho file docker-compose.yml

  vmware-exporter:
    image: pryorda/vmware_exporter
    restart: unless-stopped
    ports:
      - 9272:9272
    volumes:
      - /etc/prometheus-docker/vmware_exporter/config.yml:/opt/vmware_exporter/config.yml
    command: -c /opt/vmware_exporter/config.yml

Start

docker-compose up -d

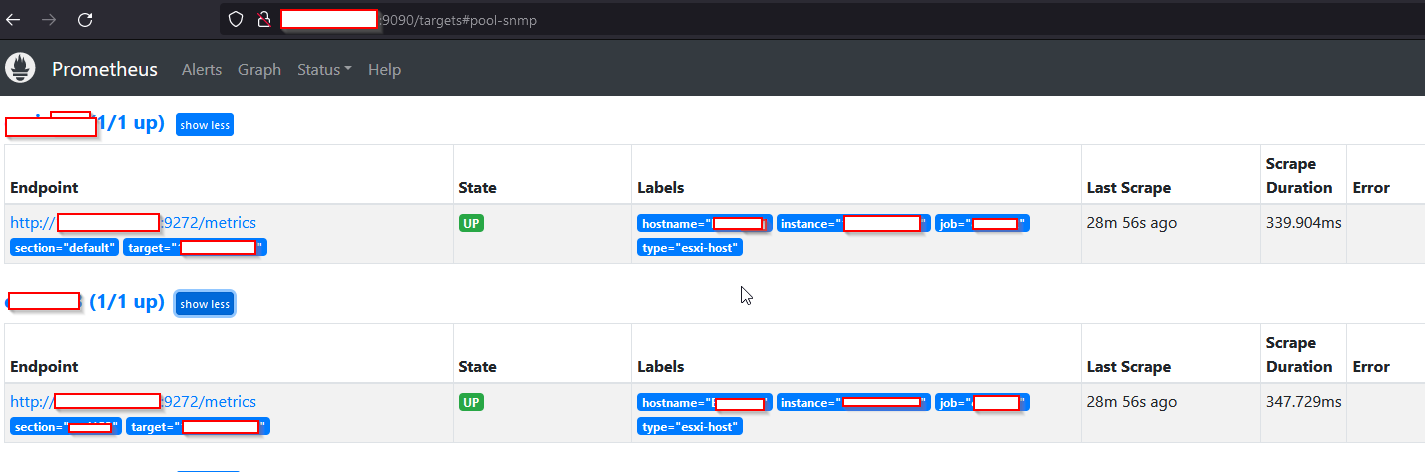
Truy cập [IP]:9272 để xem metrics từ vmware exporter và [IP]:9090 để xem prometheus (Status > Targets)

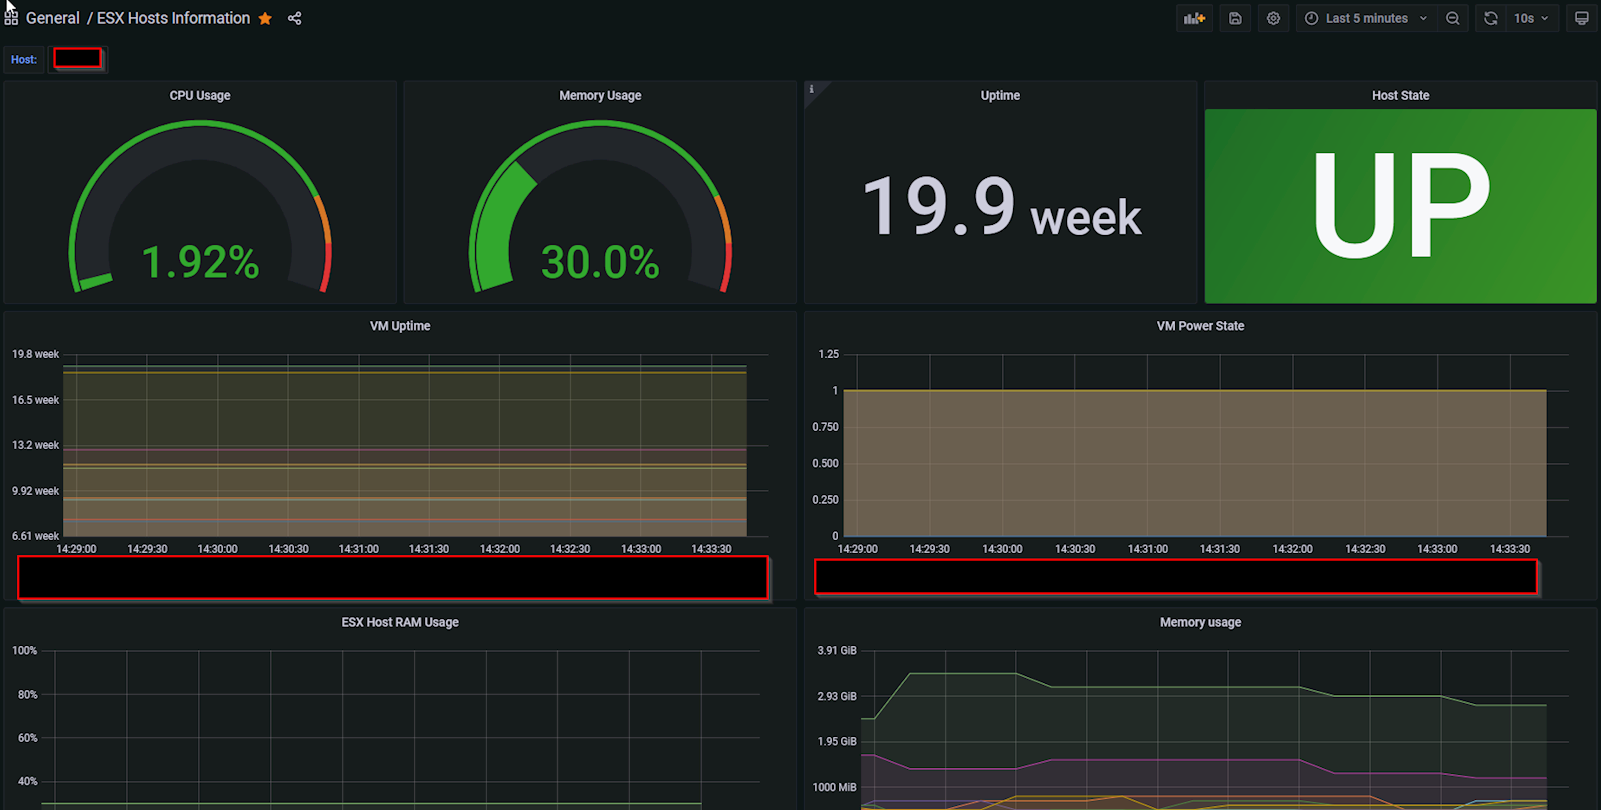
5. Tạo dashboard trên Grafana

Truy cập đường dẫn https://grafana.com/grafana/dashboards để tìm dashboard phù hợp. Trong bài viết chọn dashboard mã 7502 vì có hỗ trợ Vmware Exporter vừa cài đặt.

Kết quả sau khi tạo dashboard