Cần có kiến thức cơ bản về docker như image, container docker-compose, volumes, port, service,... và có đọc trước một chút về Prometheus và Grafana. Có 2 cách cài đặt các service trong hệ thống Prometheus là cài bằng tay (download package hoặc build source code,...) hoặc dùng các container (docker).
Bài viết sử dụng docker để cài đặt.
OS: Centos 8
- Cài đặt Prometheus và Grafana
- Cài đặt SNMP Exporter (Prometheus) để giám sát các thiết bị mạng
- Cài đặt Alert Manager (Prometheus) để gửi mail khi có cảnh báo
1. Tổng quan
Hệ thống Prometheus có 2 phần là Prometheus Server và các Node Exporter. Prometheus Server sẽ chủ động scrape các dữ liệu (metrics) được xuất ra bởi các Node Exporter. Các Exporter sẽ được cài trên các máy chủ cần giám sát và được cung cấp bởi bên thứ ba.
Do Prometheus không mạnh lắm về visualize các metrics, nên thông thường người ta sử dụng Grafana kèm theo Prometheus để visualize.
2. Pull Image
docker pull prom/prometheus
docker pull grafana/grafana
3. prometheus.yml
File này dùng để cấu hình các node (windows server, linux server,...) cần monitor (theo dõi). Các node trong file này được định nghĩa ở targets.
Sau khi cài exporter cho node nào đó thì phải thêm vào file này và start lại prometheus.
global:

  scrape_interval: 10s

scrape_configs:

  - job_name: prometheus

    scrape_interval: 5s

    static_configs:

      - targets:

          - 'localhost:9090'

  - job_name: windows-test

    scrape_interval: 5s

    static_configs:

      - targets:

          - '192.168.34.75:9182'

  - job_name: web

    scrape_interval: 5s

    static_configs:

      - targets:

          - '10.0.40.55:9182'

        labels:

          hostname: test-web

          type: windows
4. Windows Exporter
Để export các Metrics (thông số) trên Windows cho Prometheus Server, thì cần có 1 Service gọi là Node Exporter. Trong Windows thì gọi là Windows Exporter. .
Service này chạy ở port 9182, nên phải ở port 9182 trên Firewall của Windows, và Firewall trong hệ thống mạng (nếu có).
Link download exporter
Trong đường dẫn có 2 định dạng, nếu chạy luôn thì dùng .exe, còn không thì dùng msi.
Nếu chọn .msi, thì run cmd với quyền admin, sau đó chạy lệnh dưới.
msiexec /i C:\Prometheus\windows_exporter-0.18.1-amd64.msi ENABLED_COLLECTORS="ad,cpu,cs,logon,memory,logical_disk,os,service,system,process,tcp,net,textfile,thermalzone,iis"
Nếu thành công thì khi vào http://localhost:9182/metrics sẽ thấy hiện lên các thông số
5. Run docker-compose
Tạo file docker-compose.yml có nội dung dưới đây
version: '3.7'
services:
  prometheus:

    image: prom/prometheus

    volumes:

      - /etc/prometheus-docker/prometheus.yml:/etc/prometheus/prometheus.yml

    ports:

      - 9090:9090

    restart: always
  grafana:

    image: grafana/grafana

    user: "0"

    ports:

      - 3000:3000

    volumes:

      - /var/lib/grafana/data:/var/lib/grafana

      - /var/lib/grafana/provisioning:/etc/grafana/provisioning

    restart: always
Sau đó run
docker-compose up -d
Kết quả:
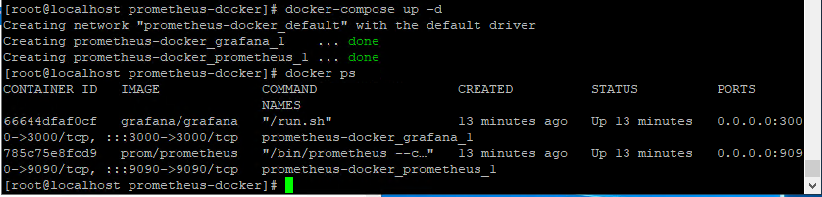
Truy cập Grafana bằng [IP]:3000 với tài khoản mặc định là admin/admin, và truy cập Prometheus bằng [IP]:9090.
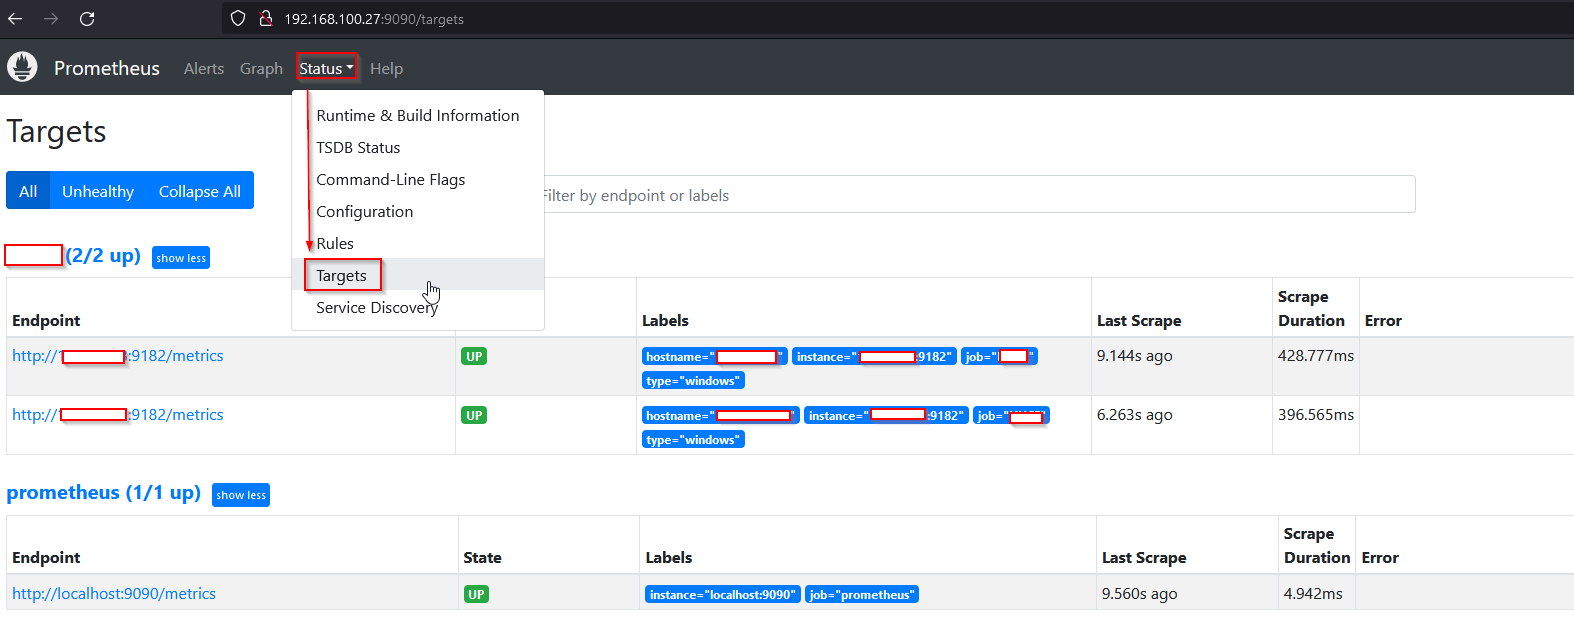
Hình ảnh sau của Prometheus Server sau khi chạy thành công
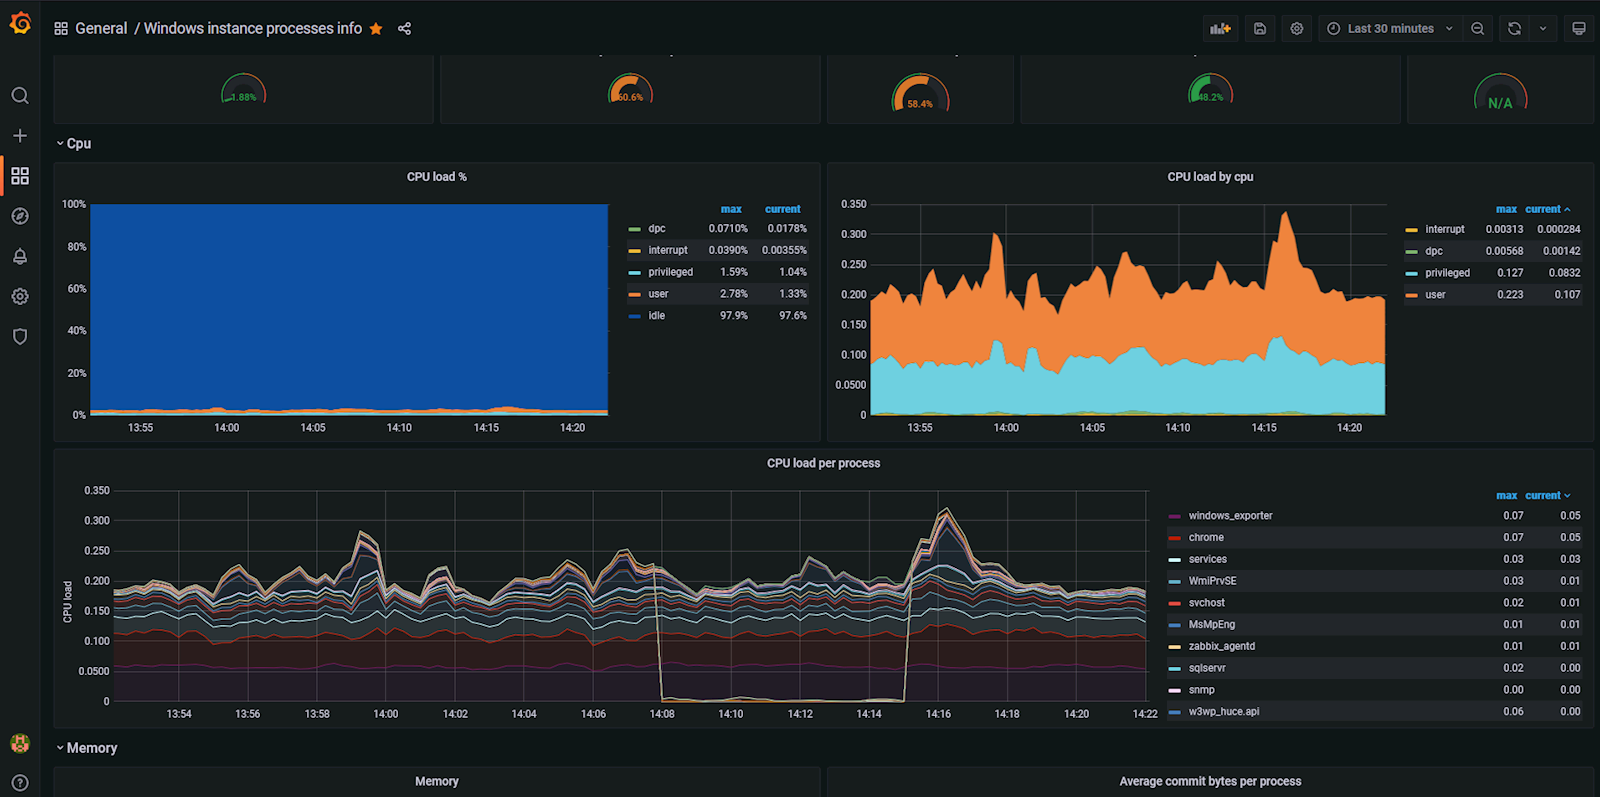
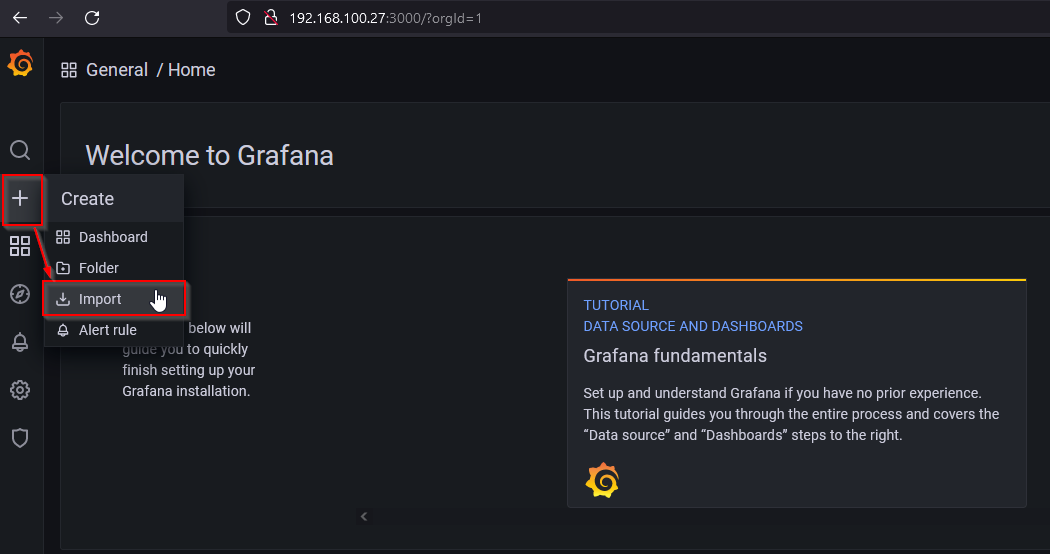
6. Grafana
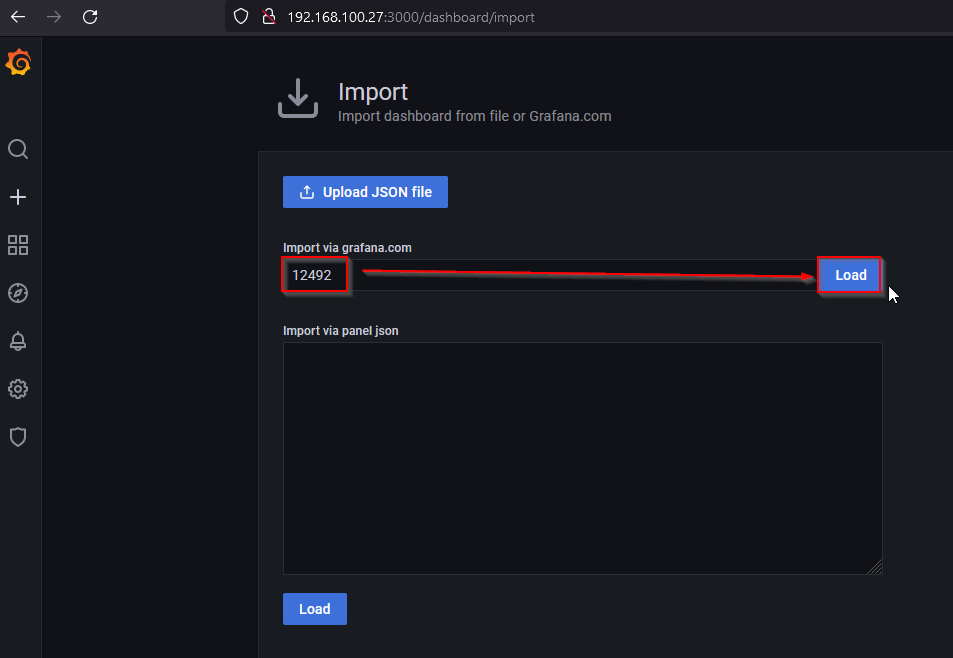
Truy cập https://grafana.com/grafana/dashboards/ và tìm mã dashboard thích hợp.
Nếu không có dashboard nào ưng ý thì có thể tự tùy biến thêm. Trong ví dụ đã tìm được 2 mã 14510, 13866.
Các hình dưới đây minh họa cho việc import dashboard
7. Kết quả